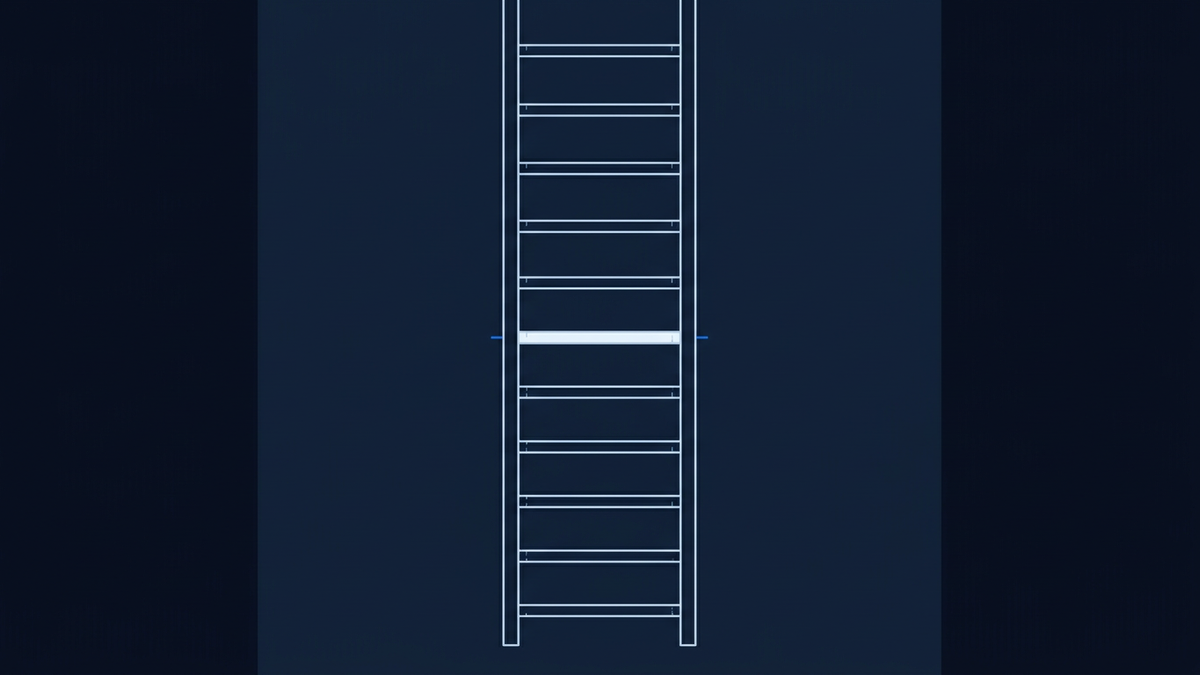
A Bitcoin ladder market is a strange thing to watch when the price action is sideways. Each rung either gets touched and locks in, or it does not. On Polymarket's Bitcoin 2026 price ladder, nine rungs have already been touched and settled this year, on both the upside and the downside, Bitcoin has printed levels above and below the current band. Those are decided facts, not predictions. The drama now sits one rung lower. The active rungs bracket current spot, with the nearest live levels just below and just above where Bitcoin is trading.
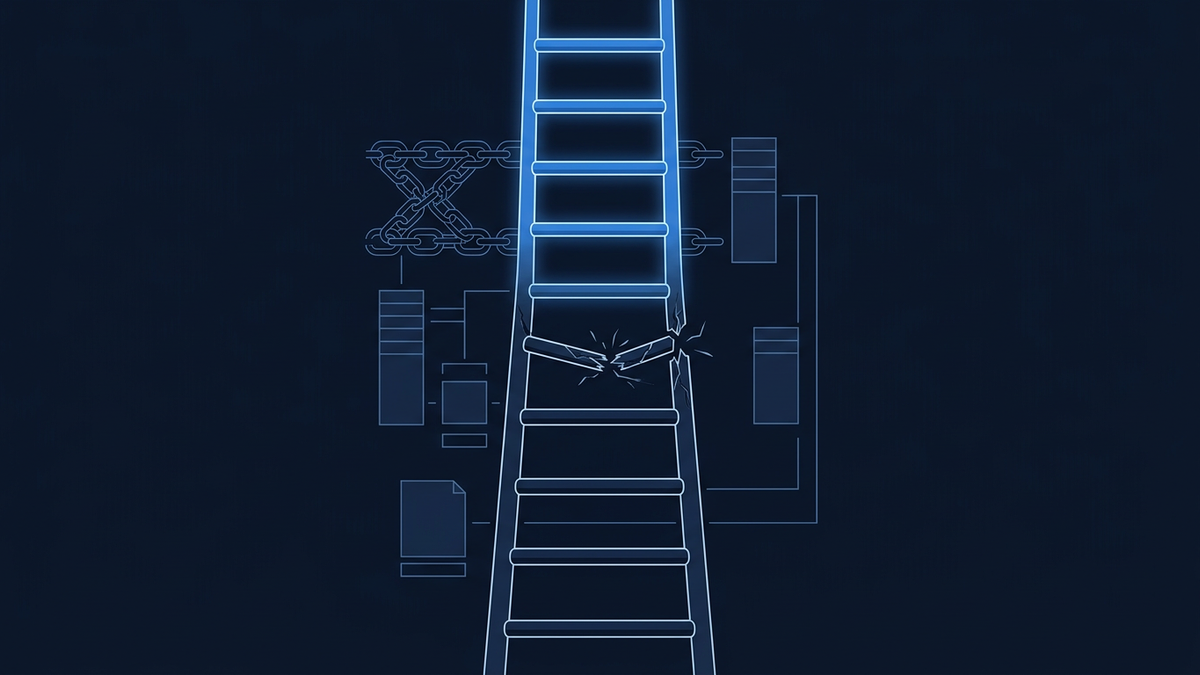
On 16 June, the leading active rung on the ladder repriced from 96% to 80%, a 16-point drop on a rung that had been priced in the mid-90s. That is what triggered this piece. The move is bound to one observation, not a trend, but it is worth understanding what the contract is actually asking before reading anything into it.
What the ladder is really measuring
Ladder markets are touch contracts, not close-of-year contracts. Each leg asks whether Bitcoin will print a given price at any point before the end of 2026, not where it finishes. The upside rungs (↑) settle YES if the price ever rises through that level. The downside rungs (↓) settle YES if the price ever falls through that level. Once a leg touches, it locks at 100% and stays there forever, which is why the nine settled rungs above and below the current price now read as concrete history rather than odds.
That structure matters because it changes how a single number should be read. The 80% on the leading active rung is not a forecast of where Bitcoin will close out the year. It is the market's collective view on whether the price will at some point in the remaining months drift across one more line on the chart. A 16-point drop on a touch contract usually means traders have updated their view of either volatility, time remaining, or how close the price is sitting to the line in question. Not their view of any year-end target.
If you want a primer on how this kind of probability translates back into a real-world likelihood, our explainer on how prediction market odds work walks through the mechanics in more detail.
What the rest of the ladder looks like right now
So what is the shape of the active ladder, as of 16 June? On the downside, ↓ 60,000 sits at 80%, ↓ 55,000 at 66%, ↓ 50,000 at 50%, ↓ 45,000 at 39%, and ↓ 40,000 at 28%. On the upside, ↑ 70,000 sits at 79%, ↑ 75,000 at 74%, ↑ 80,000 at 56%, ↑ 85,000 at 38%, and ↑ 90,000 at 32%. Beyond that the probabilities thin out fast: ↑ 100,000 at 20%, ↑ 110,000 at 13%, ↑ 120,000 at 10%, with the long-tail rungs (↑ 250,000, ↑ 500,000, ↑ 1,000,000) sitting at 2% or 1%.
Read together, the active ladder shows a market that is much more confident about modest moves in either direction than about anything dramatic. Both ↓ 60,000 and ↑ 70,000 are priced near 80% as likely touches before year-end, which is a coherent picture: traders think Bitcoin is likely to wobble through a fairly wide band before the contract resolves. The harder upside levels (↑ 100,000 and above) sit at one in five or lower. Those numbers are the load-bearing claim. The specific percentages will have moved by the time you read this; treat them as an as-of-dated snapshot, not a live tape.
Why the touch-contract mechanic matters
Here is what gets missed about ladders. A rung at 80% sounds like a near-certainty, but it is the probability that Bitcoin will touch that level once. Not stay there, not finish there, not even spend a day there. One brief print is enough. That is also why settled rungs on this market run in both directions at the same time. Bitcoin has clearly traded through 65,000 on the way somewhere and through 85,000 on the way somewhere else this year, and the ladder has dutifully locked in both.
Which means the 16-point drop on the leading rung is, mechanically, a re-rating of the probability that one specific line gets crossed in the remaining time. The reasons could be anything: slower price action over the past 24 hours, a tightening volatility regime, a shift in how much time the market thinks Bitcoin has to do something. The volume behind the move is modest, in the low hundreds of thousands of dollars, which is worth flagging. Thin flow can produce sharp repricings on touch contracts because there are fewer counterparties willing to take the other side of a binary that is close to resolving one way or the other. Our guide to what liquidity means in prediction markets covers why that matters.
The editorial take
Do not read this contract as a forecast of where Bitcoin ends 2026. Read it as a structured map of which price lines the market still thinks are in play. A 16-point drop on a single rung is one data point, not a trend, and the touch-contract mechanic means probabilities can swing on quite ordinary price action. What is genuinely interesting about the ladder right now is the symmetry: roughly equal conviction that Bitcoin will print both meaningfully lower and meaningfully higher than current levels before the year is out, with the tail probabilities for six-figure prints still alive but visibly skinnier than they were a few months ago. iPredicta tracks this kind of ladder repricing across Polymarket and the regulated venues precisely because the structure rewards close reading, and the headline number on any single rung rarely tells you the whole story.

Frequently asked questions
Does the leading rung at 80% mean Bitcoin is most likely to end 2026 at that price?
No, and this is the most common misread of ladder markets. Each rung is a touch contract, meaning it asks whether Bitcoin will print that price at any point before the end of 2026, not where it finishes. A rung at 80% is the market's collective view that the price will cross that one specific line at least once in the remaining time. The year-end close is a separate question this contract does not directly answer.
Why are some of the rungs marked as already resolved?
Bitcoin has traded through nine of the ladder's price levels at some point this year, across both the upside and the downside. Once a touch happens, the leg locks at 100% and stays settled forever. That is why looking at this ladder you see a block of decided facts at the top and bottom and an active band of unresolved rungs around the current price.