Note, 9 September 2026. The window closed on 6 September and every rung has settled. The prices below are a 1 September snapshot and are left as written, because the piece argues from the shape of the board rather than from any one number. Of the fifteen rungs on that board, three settled YES: 80,000 and 82,000 on the upside and 78,000 on the downside. The other twelve settled NO, including the 76,000 rung priced at 41% and the 84,000 rung at 14%. The 78,000 rung, the one measured from the market's creation rather than the full window, resolved YES under its own clock. Two things changed after the snapshot that a reader looking at the closed board today should know. Polymarket added six further rungs between 1 and 6 September, each with its own creation clock, so the board closed with twenty-one rungs and more than one contract at some levels: "one rung in fifteen" was true on 1 September and was seven in twenty-one by the close. And lifetime turnover, just under $102,000 on 1 September, finished at about $1.69 million.
There is a specific kind of Bitcoin contract that reads less like a forecast and more like a checklist. It does not ask where Bitcoin closes. It does not ask where it ends the week. It asks, for each price rung on a ladder, whether Bitcoin touches that level at any point across a defined seven-day window. This week's window runs from August 31 to September 6, and the ladder is already live on Polymarket.
That framing matters more than any single number on the board. A touch-any-time contract behaves very differently from a close-of-week contract, and the difference shapes what a reader should and should not take from the prices. The Bitcoin August 31 to September 6 price ladder on Polymarket sits at the centre of this piece as a worked example of that structural point.
Deposit $20, get $50 to trade
Welcome bonus on the world's largest prediction market.
18+ · New users only · Availability and terms vary by region · Trading involves risk of loss · BeGambleAware.org
What the ladder actually asks
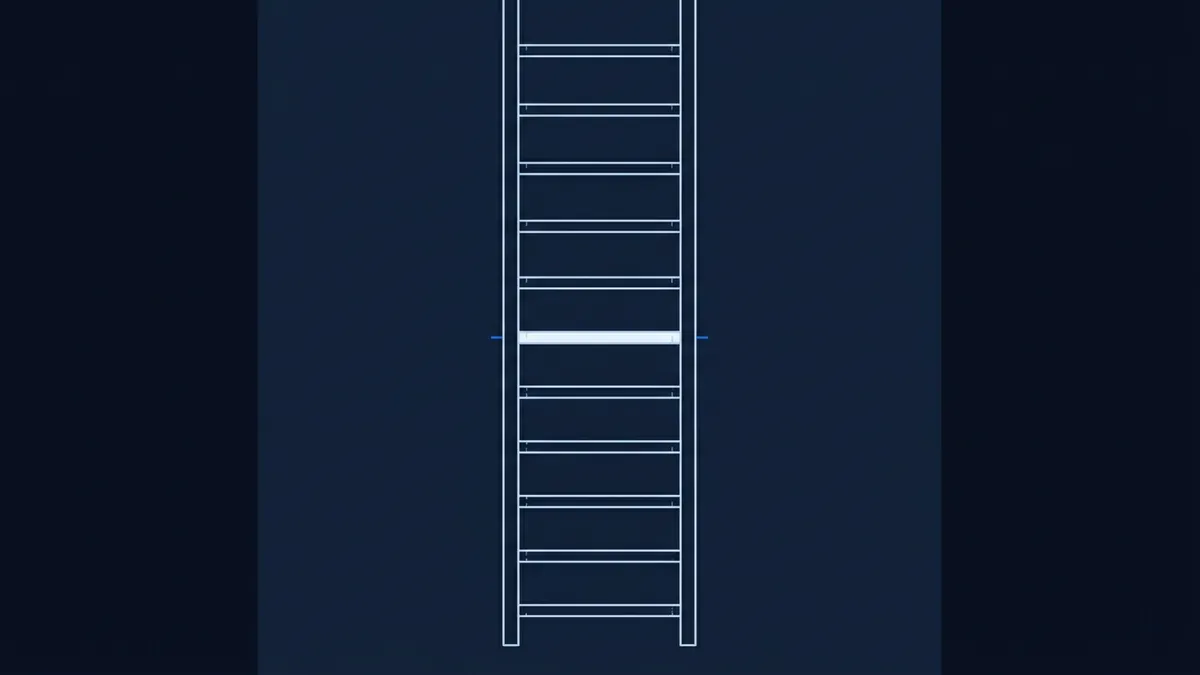
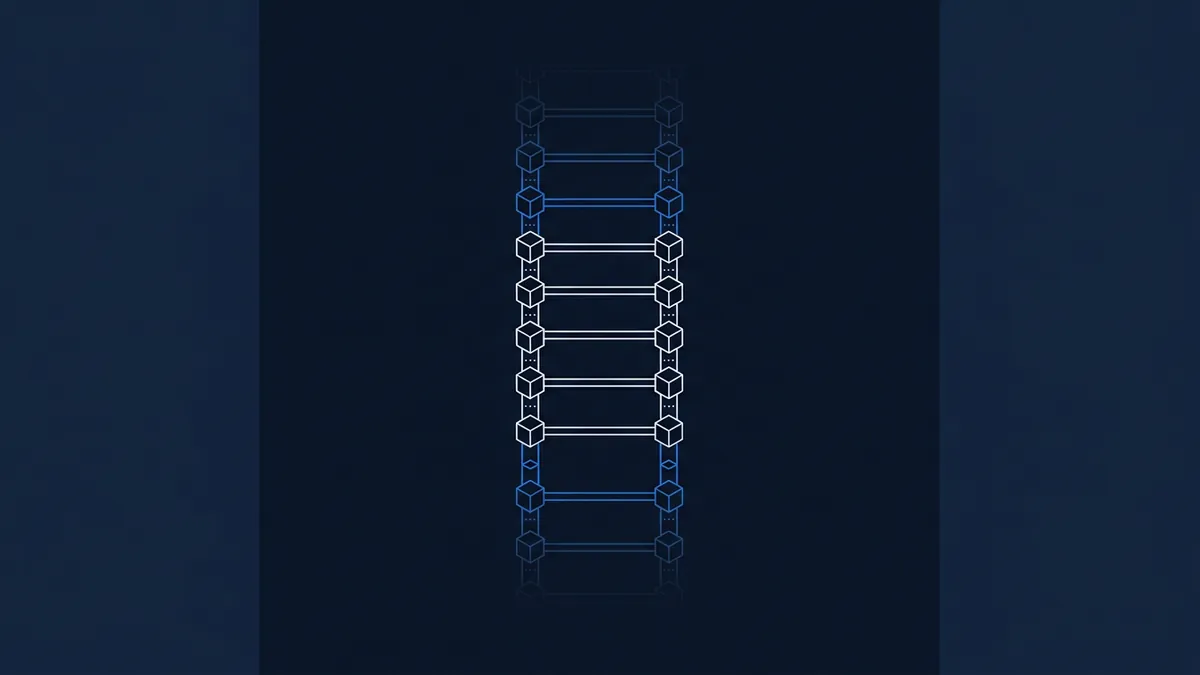
Picture a set of rungs stacked either side of the current spot. Above the market: 80,000, 82,000, 84,000, 86,000, 88,000, 90,000, 92,000. Below the market: 78,000, 76,000, 74,000, 72,000, 70,000, 68,000, 66,000, 64,000. Each rung is its own YES/NO contract. Each one resolves YES if Bitcoin trades at that level at any point during the window, and NO if the week finishes without a touch.
The rungs are not mutually exclusive. That is the part newcomers most often miss. If Bitcoin swings hard in either direction across the week, multiple rungs on that side can resolve YES together. If price wobbles through a narrow band, several nearby rungs on both sides can settle YES at once. The ladder is not asking the market to pick one outcome; it is asking, level by level, how far the wick reaches.
That structural point has a knock-on effect. Because rungs closer to spot are easier to touch than rungs further out, prices decay outward from the middle in a predictable shape. The 80,000 and 78,000 rungs, as of September 1, are priced as the most likely to resolve YES; the 92,000 and 64,000 tails sit at 1% and under 1% respectively. None of that is a directional call. It is the geometry of a touch contract.
Reading the ladder without reading too much into it
A common mistake with these weekly Bitcoin markets is to treat the ladder as a probability distribution. It is not. A close-of-week contract, where only one outcome can win, does produce something close to a genuine distribution over price. A touch-any-time ladder does something else. It produces a set of independent barrier probabilities, and those barriers are not competing.
This is where it is worth separating two contract shapes that look alike on a screen and behave nothing alike. A partitioning ladder asks where a price finishes and carves the outcomes into slices that cannot both happen: exactly one wins, and the prices should sum to about 100. A touch ladder like this one asks whether each level is reached at all, and the answers overlap by construction. On a partitioning ladder, rungs summing past 100 is an arbitrage. On a touch ladder it is the expected state of the board. Same visual grid, opposite arithmetic, and reading one as the other is the single most common way these contracts get misreported.
This is why summing rungs to build a "market-implied" chance of a big move is a fabrication rather than a calculation. The rungs already overlap. A YES on the 84,000 rung almost guarantees a YES on 82,000 and 80,000, because Bitcoin cannot touch 84,000 without passing through them. So the sensible reading of the board is qualitative: how far up and how far down does the market treat as plausible touches, and where does the price of a rung fall off a cliff.
As of September 1, that cliff is fairly visible on both sides. The 80,000 rung sits at 70% and the 82,000 rung at 33%; step out to 84,000 and it is 14%, then 6% at 86,000, then into low single digits. On the downside, the 78,000 rung sits at 87%, the 76,000 rung at 41%, and the 74,000 rung at 15%. The tails on both sides are priced as remote. What the ladder is telling you, structurally, is the width of the band the market thinks is in play this week. Not the direction.
Why the resolution rule shapes the trade
A touch-any-time settlement rewards volatility in a way a close contract does not. Buying a distant rung on a close-of-week market requires the reader to be right about both direction and finishing point. Buying the same distant rung on a touch ladder only requires the price to graze that level at some point across seven days, even for a single print, before reverting. This is one reason far-out rungs on touch ladders tend to be priced higher than an equivalent close-of-week strike; the barrier is easier to clear.
It is worth being specific about what "touches" means here, because the part of this contract that most changes how it trades is the part the board does not show you. All fifteen rungs settle on Binance one-minute BTC/USDT candles. An upside rung resolves YES if any one-minute candle's High reaches the level; a downside rung resolves YES if any candle's Low reaches it.
Three things follow, none of them cosmetic. The reference is USDT, not dollars. The reference venue is Binance, not whichever exchange a reader happens to be watching. And a single one-minute wick counts, which is a much lower bar than a sustained move.
The gap between that and a reader's own chart is easy to see. Look at Kraken's BTC/USD twenty-four-hour low on 1 September and it prints below the 78,000 level. On a naive reading the 78,000 rung has already been touched and should be trading close to certainty. It is at 87%. A low printed on Kraken in dollars simply does not resolve a contract that settles on Binance USDT candles, and the basis between the two is enough to sit either side of a round number. If you are going to trade a barrier, the barrier is defined by its source, and checking the price on the wrong venue is the most ordinary way to be confidently wrong about where a rung stands.
One further wrinkle rewards reading the rung you are actually trading. Fourteen of the fifteen rungs count the full calendar window, midnight ET on 31 August through 11:59pm ET on 6 September. The 78,000 rung does not: its text runs from the market's creation and states that price action before creation will not be considered. That is one rung out of fifteen carrying a different clock, on a board that otherwise looks uniform, and it is the sort of detail that only shows up if you read the contract rather than the grid.
It is also why the shape of the ladder can shift quickly during the week. A single sharp candle in either direction can convert several rungs at once. That is the mechanical reality of a barrier contract, and it makes the ladder unusually reactive to intraday moves rather than to daily closes. For readers coming from options markets, the closest analogue is a one-touch structure rather than a European binary. If you have not yet worked through the basics of prediction market pricing more generally, our explainer on how prediction market odds work walks through the cents-to-probability translation that all of these rungs rely on.
What the volume tells you, and what it doesn't
This is a small market by prediction-market standards. Lifetime traded volume, as of September 1, sits just under $102,000. Most of that turnover has arrived very recently, which is normal for a weekly contract that only becomes tradable as its window opens. It is priced right now because the window is now.
That matters for how much weight to put on the individual rung prices. A ladder with a few hundred thousand dollars of turnover across fifteen legs is not going to be as tightly arbitraged as a headline political market with millions of dollars sitting on a single yes/no. The middle rungs, where most volume concentrates, will be reasonably efficient. The tails may drift more on thin flow. The board is directionally informative about what traders think is in play; it is not a finely-machined probability estimate at every rung.
iPredicta tracks these weekly Bitcoin ladders as they roll over, and the touch-contract shape is the reason we treat them as a structural read on volatility expectations rather than a directional call. The August 31 to September 6 contract sits on our watch list for exactly that reason.

Frequently asked questions
Does the ladder tell me where Bitcoin will close on September 6?
No. Each rung on this contract resolves YES if Bitcoin touches that price at any point during the window, not based on the closing price. Several rungs can resolve YES in the same week if price ranges widely, so the ladder describes touch probabilities, not a distribution over the final print.
Why do rungs closer to the current price have higher prices?
Barrier contracts price outward from spot because a nearby level is mechanically easier to reach than a distant one. On the September 1 snapshot, the 80,000 rung sits at 70% and the 78,000 rung at 87%, while the 92,000 and 64,000 tails sit at 1% and under 1%. The decay is geometric, not a directional forecast.